We often hear questions about how the government, or different political movements, may reshape and impact markets. Just to name a few topics of concern:
- Is government spending unsustainable? Will the national debt and deficit wreck our economy in the short term or long term?
- Does the government have a handle on inflation? Will they cause, or allow, prolonged inflation to wreck the economy?
- Can I rely on Social Security and Medicare being around for me, or are they “going broke?”
- How could geopolitical events impact markets? If Russia uses nuclear weapons in its war with Ukraine, could that trigger a market catastrophe?
- What about our competition with China? Will increasing tariffs and protectionism derail the growth that globalization brought us? Will the erosion of the US manufacturing base cause our economy to stagnate and enter decline?
I could go on, but those are the 5 topics I hear most often. I’ll take them piece by piece, starting with: Is government spending unsustainable? Will the national debt and deficit wreck our economy in the short term or long term?
How big is the US national debt?
There are a lot of ways to answer this question. The first, and most jarring way, is to just look at the actual number which is… a lot! As of Q2 2022, US government debt exceeded $31 trillion.
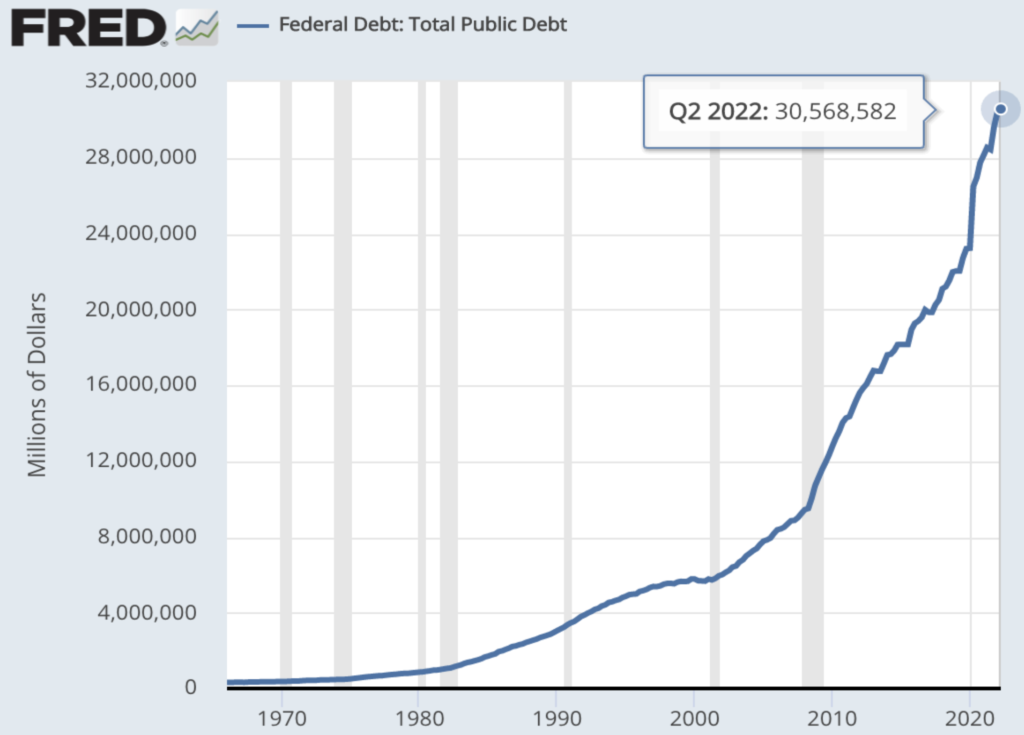
But, how big is $31 trillion?
First, I’d assume you’re talking about today. In just the last 30 years, the average mortgage has quadrupled. So, our first observation should be that, because of the impact of inflation over long periods of time, just looking at the $ growth alone is not going to give us a clear answer.
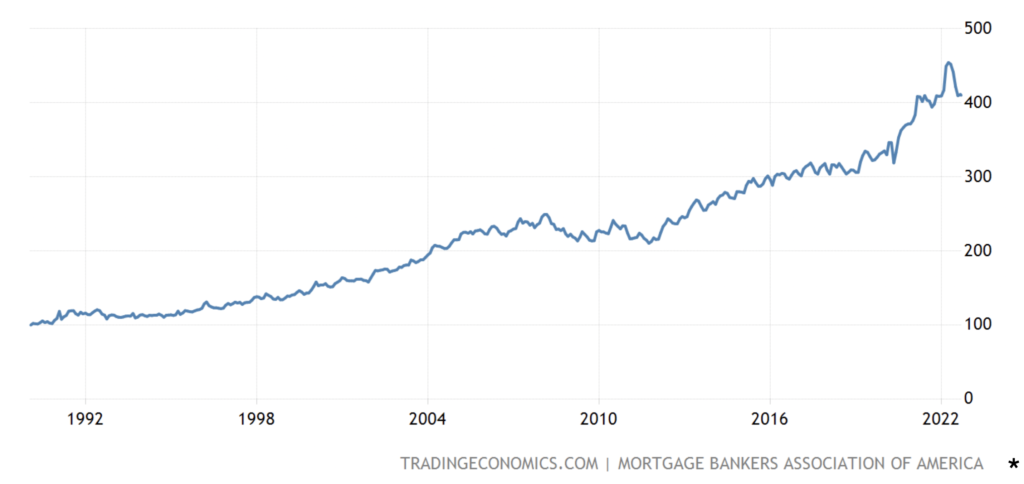
https://tradingeconomics.com/united-states/average-mortgage-size
*To replicate graph, please set data set to “Max” time periods
But, back to the original question–how big is $31 trillion–lets think about a different type of debt situation that everyday people face: applying for a mortgage. If I asked you, “is a $300K mortgage big,” what would you say? I’d say, that depends: big to whom? Are we talking about someone making $30K per year? Yes, a $300K mortgage would be an eye-popping 10x their annual income. What about someone making $300K per year? Not so much.
Indeed, if you’re a bank looking to lend to someone for a new home, and you’re trying to decide what mortgage is “too big,” one of the primary things you’ll look at is a debt-to-income ratio. These types of measurements are helpful for two reasons:
- Debt and income both change with inflation over time, so we don’t have to account for inflation
- It helps us hone in on what really matters: how much do you owe relative to your ability to pay the debt off?
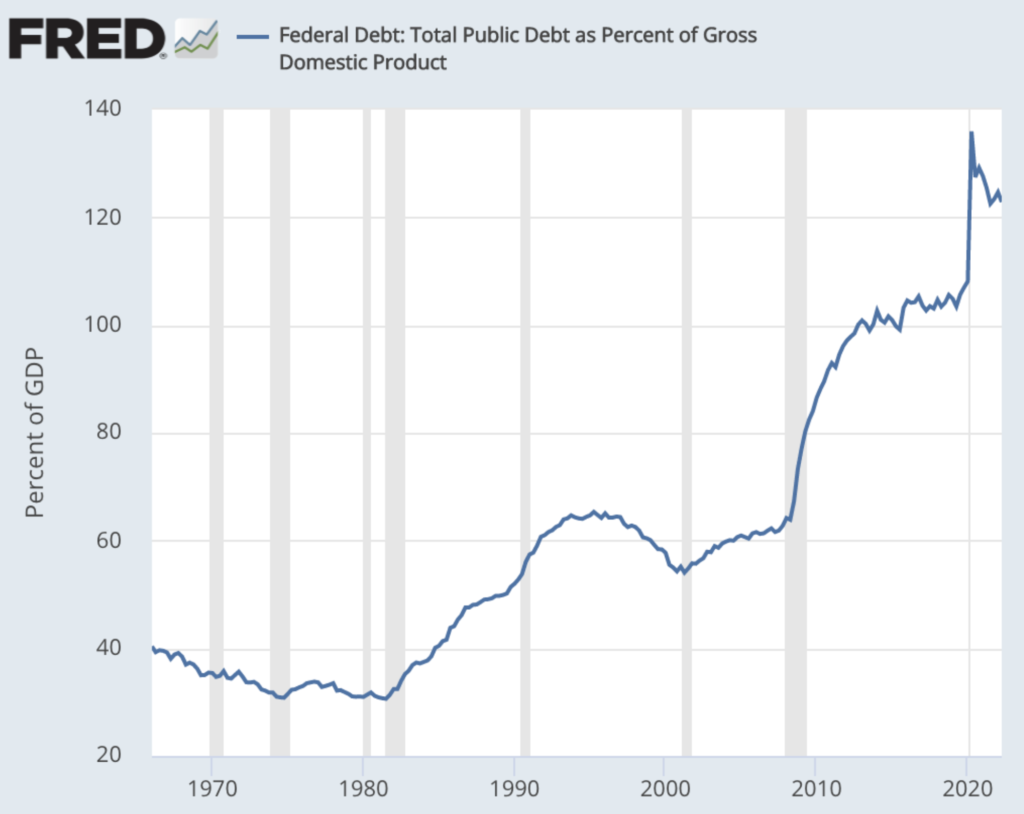
As you can see, the federal debt as a % of GDP has indeed grown over time, with a sharp spike upward in the midst of the last two recessions. To translate this into income terms, the federal government owes slightly more than 1.2x the value of all goods and services produced in the US within a year.
But, that’s still not a perfect way to look at it. After all, the federal government can’t use all the money in the economy to pay the debt. In fact, there is a better term for the income that the federal government has available to it: taxes.
So, here we get to what may be the closest analogy to the mortgage/income situation: the multiple of current government debt to federal tax receipts:
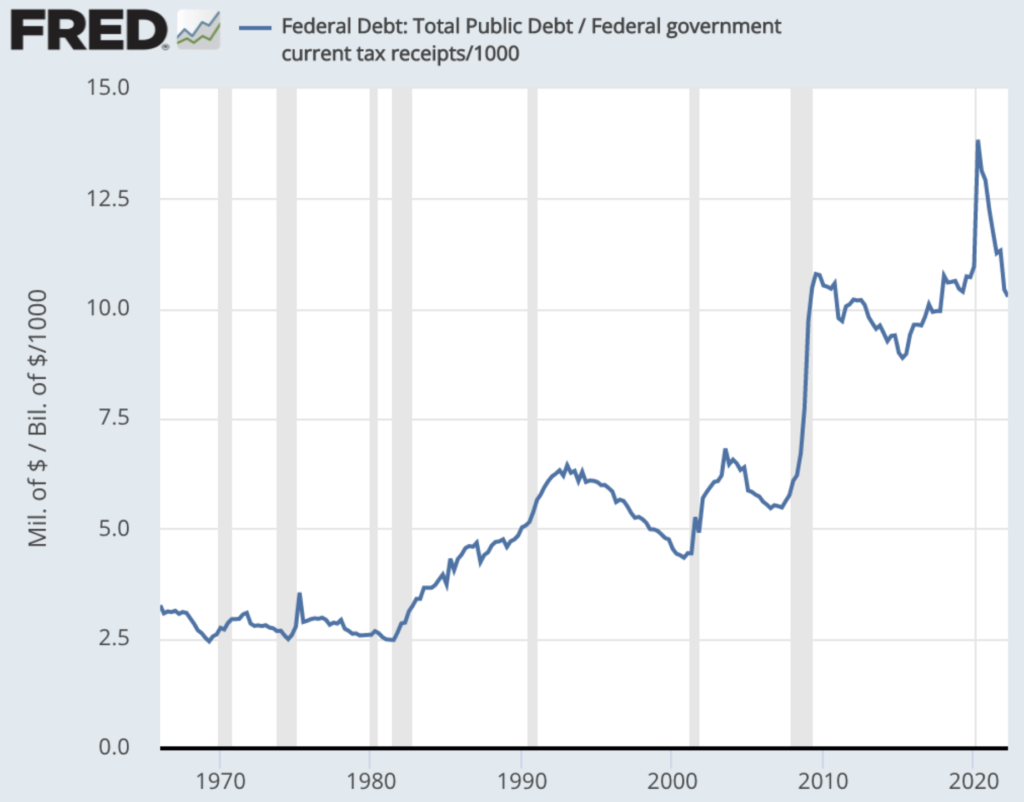
While this graph looks different, it tells the same basic story: we’ve had a large uptick in national debt relative to the governments source of funds to pay the debt since 2008. As of right now, we’re back around where we were just after the spending following the 2008 financial crisis.
So, my conclusion: how big is the national debt? Jury says: pretty big!
But, at the same time, maybe not as big as scary headlines make you think. While it is true to say that the national debt has gone up 10x since 1990, that’s a misleading way to think about it. In terms of the debts size relative to the economy (debt/GDP), it has slightly more than doubled.
Is the size of the US national debt unique? Is it unprecedented?
The answers to these questions are interesting, but not dispositive.
Is it unique or unprecedented that I gain 5-10 pounds around the holidays? No, but its not great, either.
But, to set aside my holiday eating habits for a second, we can easily compare the current US national debt to other countries both in the present and the past.
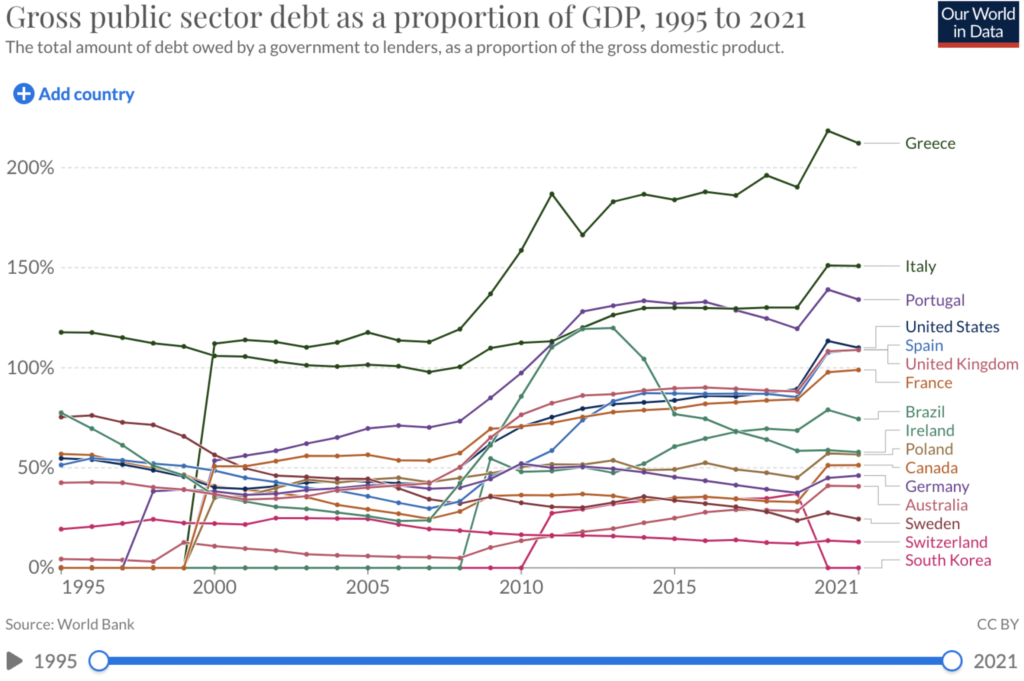
As you can see, the US is not currently a major outlier in terms of national debt. We’re right in line with the UK, France, and Spain. Doing better than Portugal, Italy, and Greece. But, much worse than the thrifty Canadians, Germans, and South Koreans near the bottom of the graph.
Now, if you were worried about the national debt, there are two ways to interpret this graph:
- It’s a relief to see that the US doesn’t have uniquely high national debt
- Thanks a lot, Adam. Now I’m worried about France too.
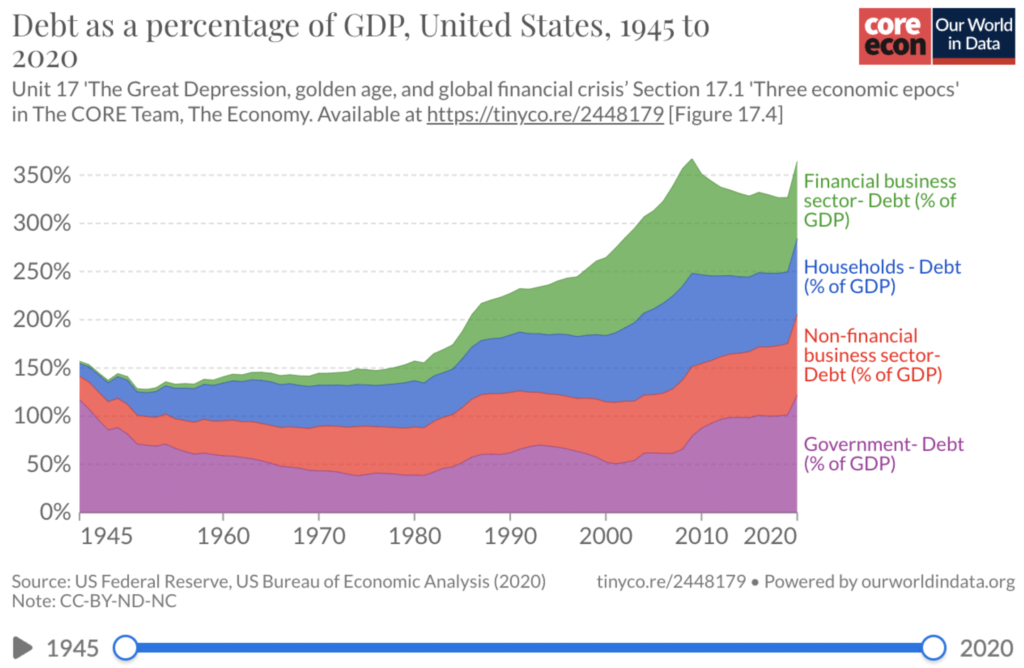
What about the second part of my question though? Is debt to GDP above 100% unprecedented?
For better or worse, the answer to that is: no.
*To replicate the graph, please choose “Interactive Graph”.
Check out the US debt just after WWII.
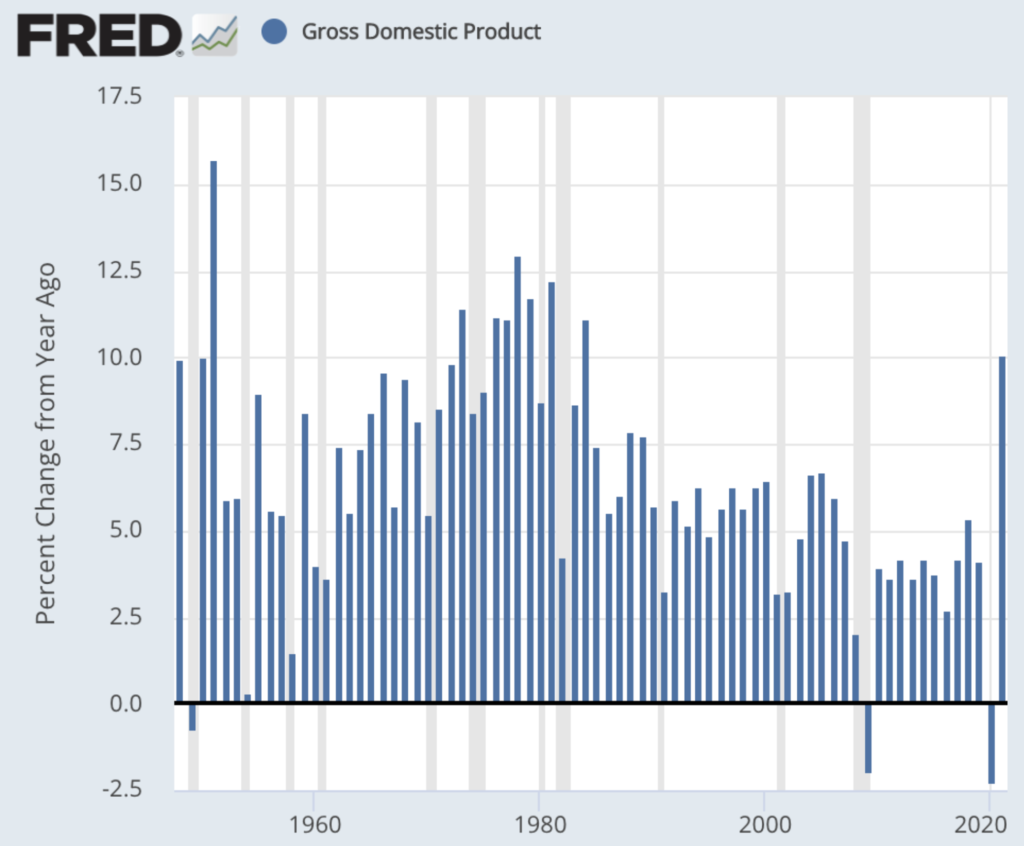
So, we’ve been here in the past: how did we get out of it?
First, we grew the economy. Obviously, this is an ideal way to handle debt—by making everyone richer. You can see, in the 50s and 60s, we had several years of GDP growth in excess of 5% (something we’ve rarely accomplished in the last 10 years).
But, also, taxes were higher. Not by a ton, but by a reasonably significant amount. As you can see, federal taxes constituted around 14% of GDP in the 20 years after WWII, while recently they’ve averaged closer to 10%.
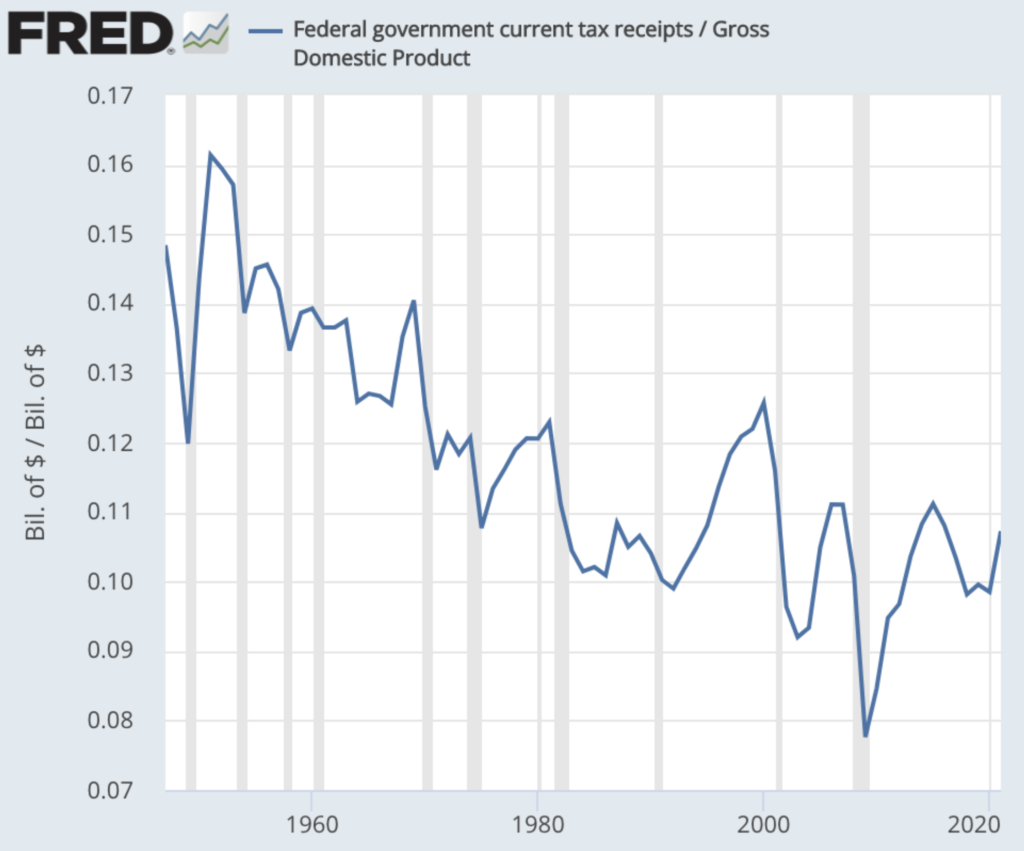
So, to answer the question: how did the US handle the last time we had debt/GDP in excess of 100%? The answer is: we grew our income, and paid it down.
But, what about other countries? Are there any other historical examples of countries reducing high levels of debt to GDP?
Why, yes! Look no further than our pals in the UK. They ran up quite a tab fighting in WWI and WWII, peaking at over double the debt level the US is currently at.
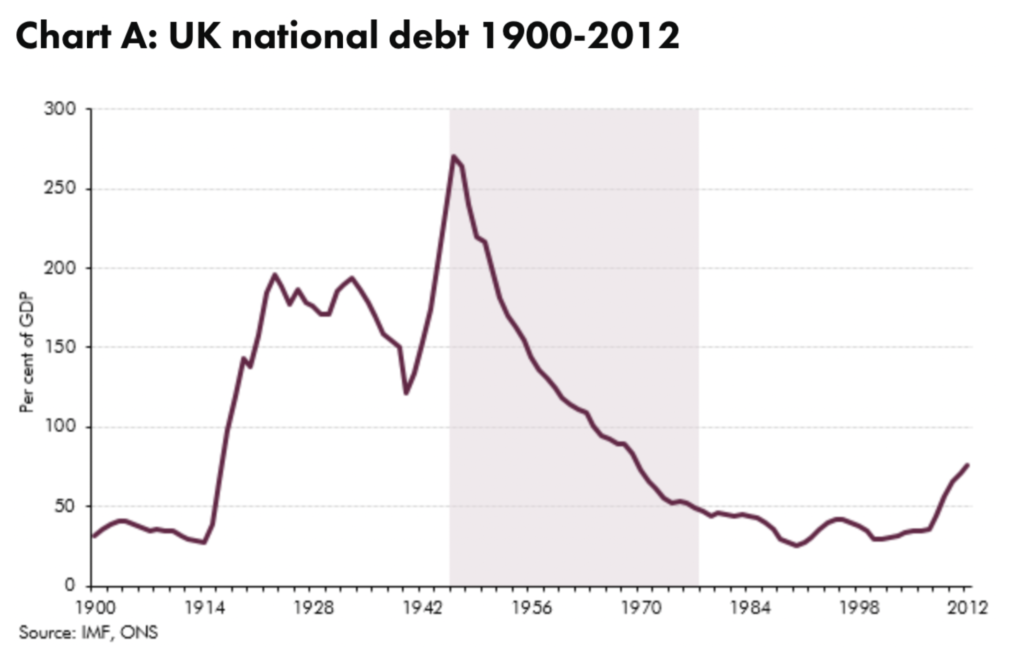
Unfortunately, the way they fixed their debt problem was, uh, less inspiring, to put it mildly.
You see, the place where our mortgage analogy really breaks down is that you owe the bank US dollars. Because you are not the US government, you have to get those dollars from someone else; you can’t print yourself extra. But, governments do have that power.
And, in essence, that’s what the UK did. Unlike the US, the UK did not have a postwar boom in real economic growth. Instead, they let inflation run rampant, eroding the value of the debt. In fact, in that shaded period in the graph above, the UK paid an interest rate of 3.6% on their national debt, but inflation ran at 6.5%! That means, each year, the “real” value of their debt shrank by more than inflation.
But, at the end of the day, financial shenanigans like this aren’t a get out of jail free card. Money is nothing more than a tool to divide up and share all of the actual stuff (goods and services) that our fellow human beings produce. So, while inflating away the debt meant the UK government didn’t have to “pay it themselves,” it instead meant that the investors that held that debt suffered real losses. And consumers found any wealth they had sitting in cash evaporate as inflation eroded their purchasing power.
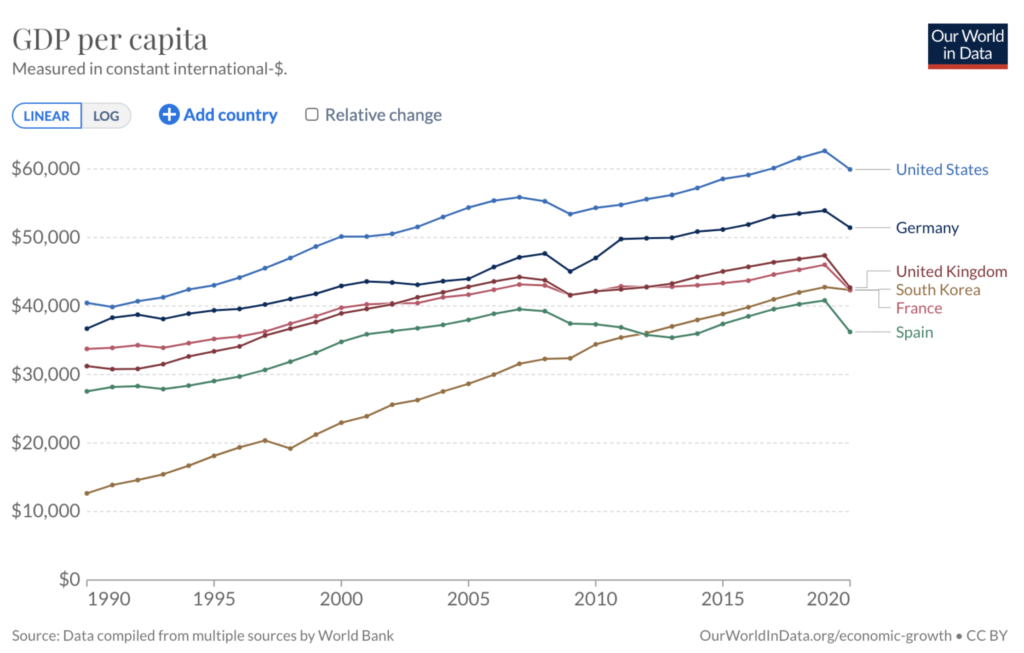
Now, were there terrible consequences to these shenanigans for the UK? While I’m sure investors who held UK government debt were not thrilled, the modern UK is not desolate and impoverished. While they don’t have quite the level of GDP per citizen of the US, or high growth rate of a newly industrialized economy like South Korea, they are in the middle of the pack compared to their European neighbors.
So, lets circle back and definitively answer the question: Is the size of the US national debt unique? Is it unprecedented?
No, and no. Good or bad, right or wrong, several other countries are in a similar situation. The US has been in this situation in the past and navigated it successfully by relying on strong economic growth. The UK has been in a much worse spot, and while they didn’t handle it in a way that I would call “admirable,” it did not plunge the UK into a period of material deprivation and economic collapse.
Is the US national debt sustainable?
In the previous section, we made an implicit assumption when we looked at US and UK debt following WWII. We assumed that it was inevitable that the debt would have to be reduced. But, is that the case?
Let’s go back to the mortgage example. Bankers don’t just look at what the total mortgage loan amount is relative to your income. In fact, buyers and bankers alike usually focus more on the monthly payment relative to your income. And, while mortgages are engineered to be completely paid off over time, nothing is stopping you from refinancing your home over and over again, rolling forward that debt forever. In fact, that is the basic premise behind home equity loans.
So, how does that analogy carry to the US?
Well, we could look at the total cost of federal interest relative to GDP. This tells us: how much of the economy’s production is going toward maintaining the national debt?
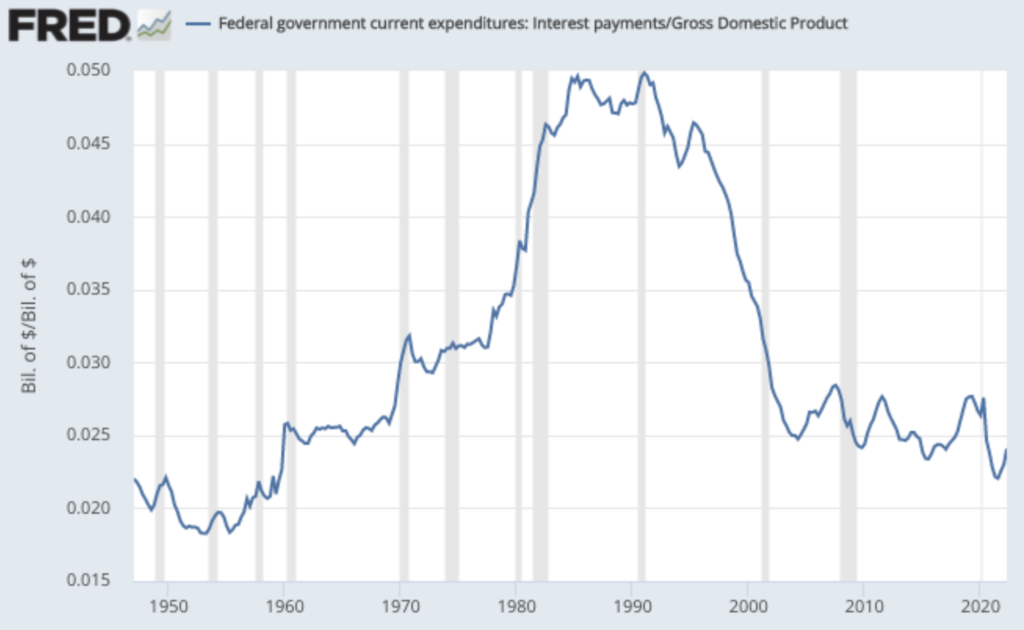
Surprisingly, since 2010 when the national debt level began to spike, total interest costs on that debt actually trended slightly downward. This situation is analogous to a someone being able to afford a larger home when interest rates are lower. So, if the long-term interest rate environment stays roughly the same going forward, the interest payments on that debt are not only likely sustainable: they’re actually a decent amount lower than they were in 1970 through 2000.
But, there’s a catch in this analogy: most mortgages bear a fixed interest rate for 30 years. So when the bank is deciding whether you can afford the payment, they’re assuming that payment will stay the same. And while a portion of the governments debt is issued in 30 year, fixed rate maturities, a lot of it is not. The red box below shows the balance of debt in Bills (term of less than 1 year) and Notes (term of between 1 and 10 years). So, as of this writing, over half of the government’s debt will have to be rolled over in the next ten years, potentially at a higher interest rate.
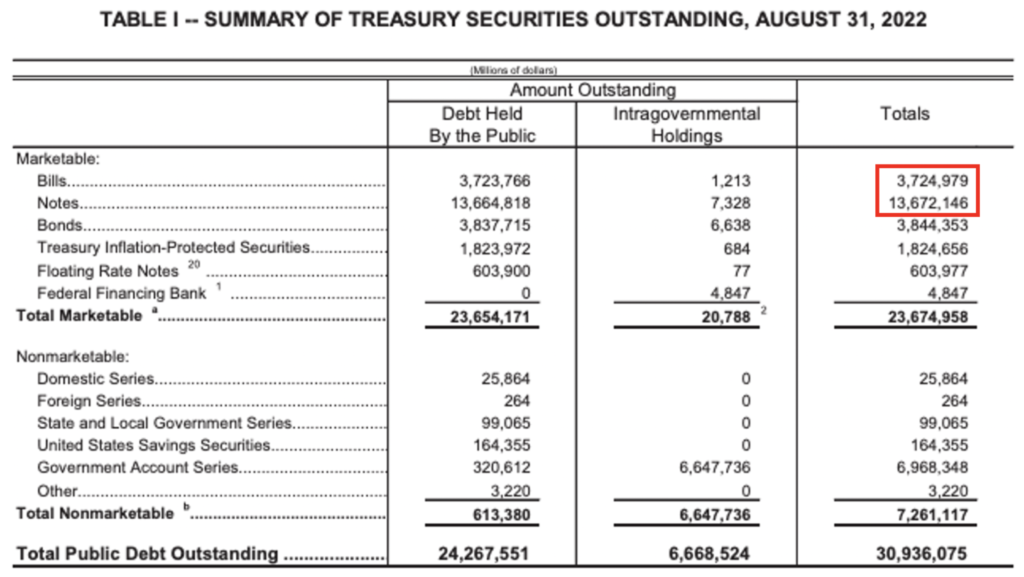
**To achieve same result, Under “Preview & Download”, select “Published reports”, Then “previous” report date, and input data for August of 2022.
As of this writing, the Federal Reserve is intensely hiking interest rates to battle inflation. Here’s what they’ve done so far:
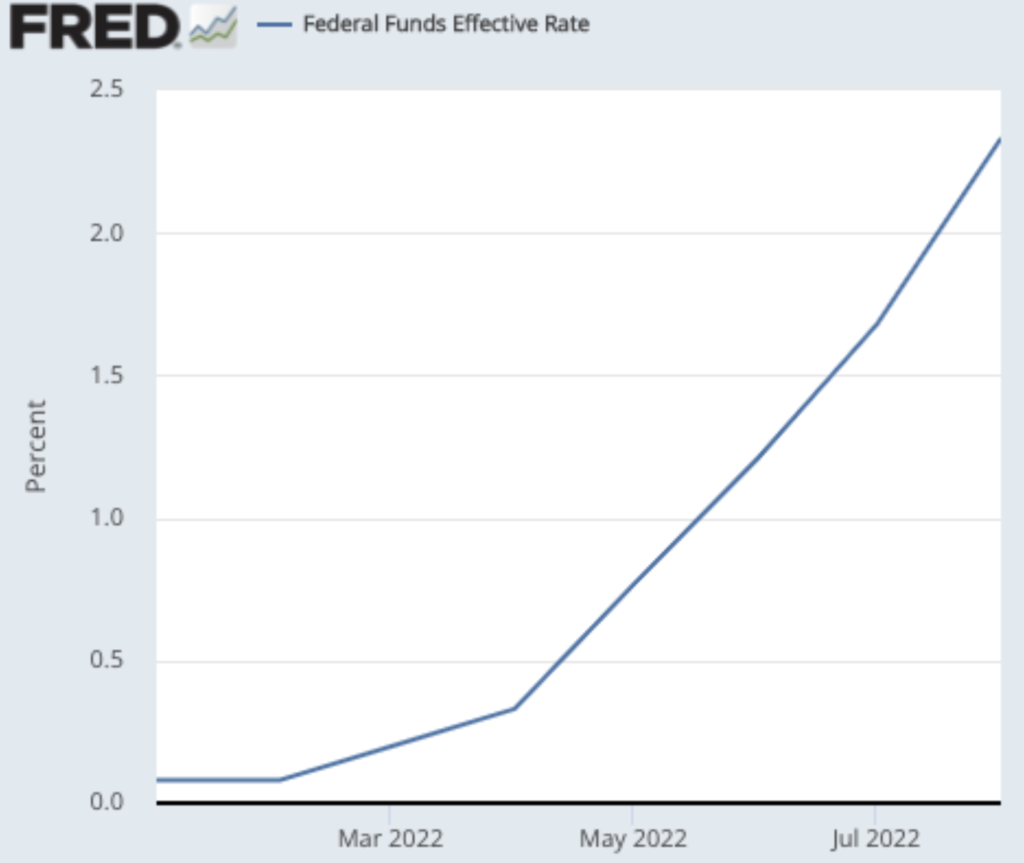
Here’s where they say they think they’ll go (peaking around 4.5%):
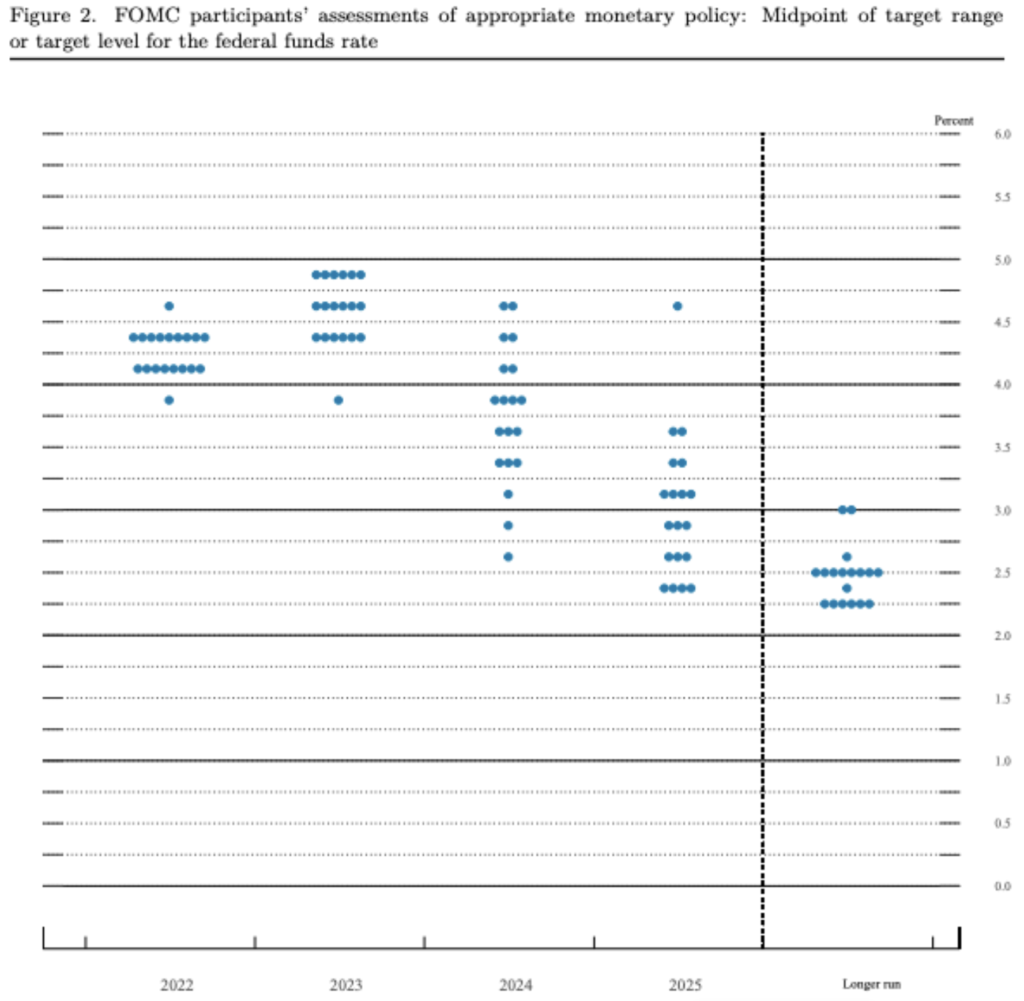
*Page 4 of the article
But, we also need to put that in context. Here’s where rates were over the last 70ish years:
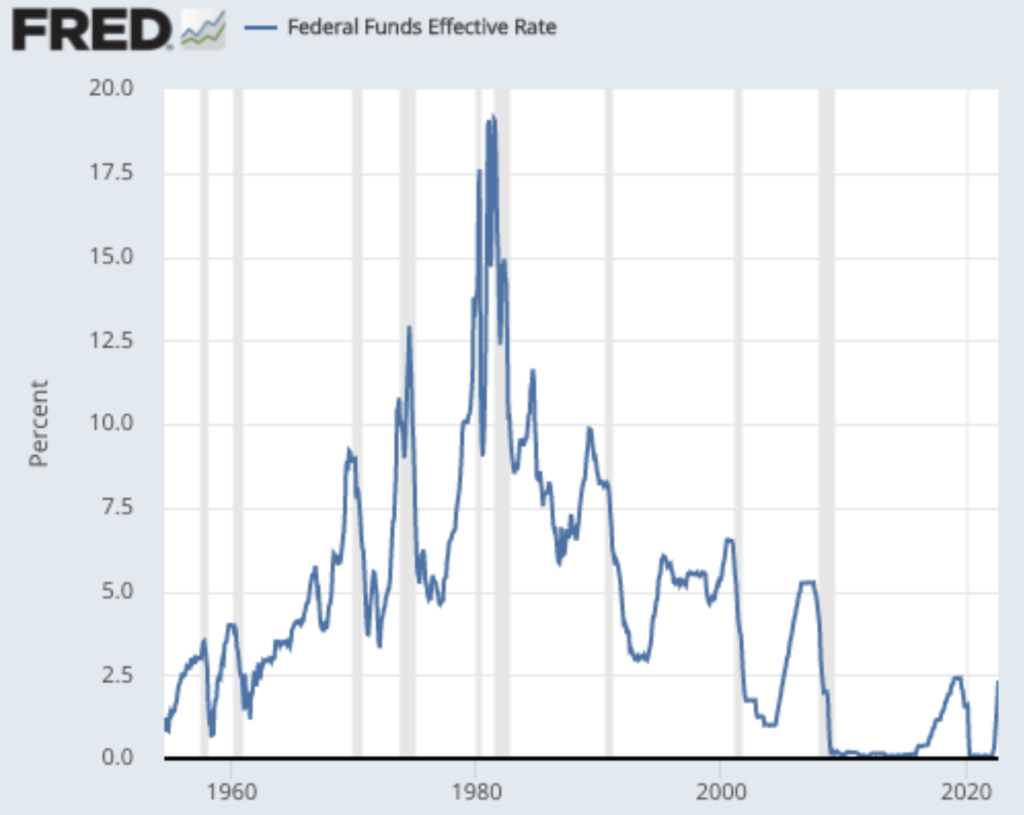
As you can see, the Fed currently plans to max out rates at a level (~4.5%) that is below the level rates were at for much of the period between 1970 and 2000, when interest costs on the federal debt constituted a higher level of GDP. Will the Fed be right? Are they going to be able to stop at that level and still beat inflation? I don’t know, and I bet they don’t really know either!
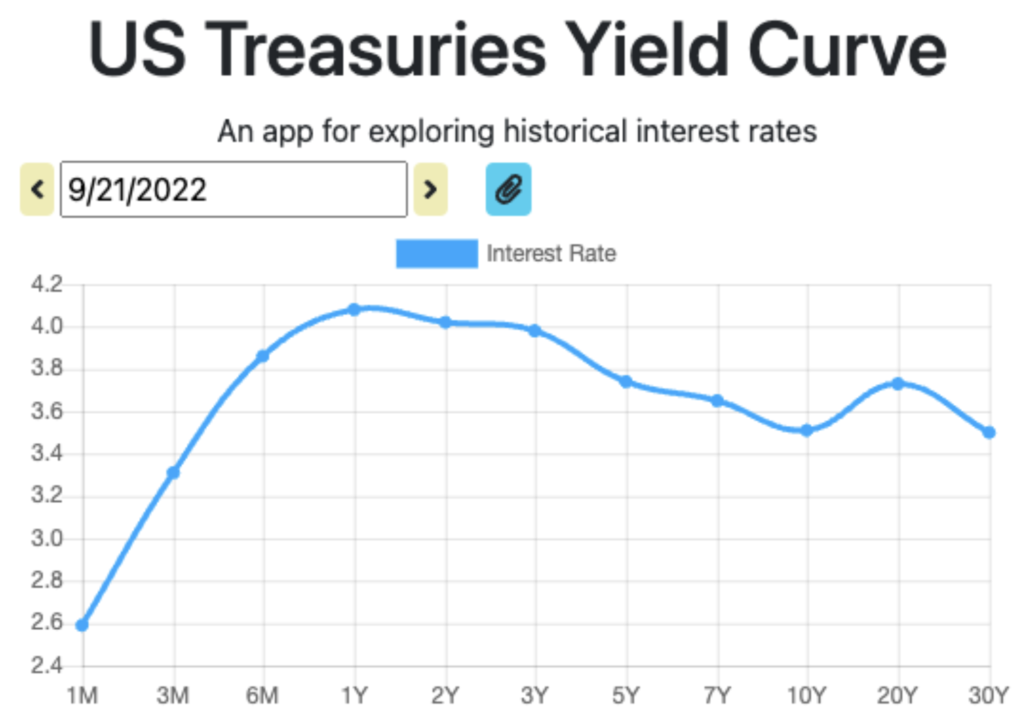
For what its worth, if the market was predicting interest rates to keep climbing past 4.5%, we’d expect longer dated treasury notes to have an interest rate above 4.5%. That’s because, if you believe rates will be above 4.5% in 3 years and stay there, you’re not going to loan the government money for 5 years at 4.5%. You’d rather loan them money for 2 years at 4.5%, and then purchase a 3 year treasury note 2 years from now at that higher-than-4.5% rate you’re predicting.
This is not the prediction we are seeing in the market. The market is pricing a 5 year treasury note below 4.5%, and even below the 2 year note rate of around 4%, suggesting the market is predicting that over the long term, the Fed will not be maintaining rates above 4.5%. Is the market always right? No! But, it’s a good starting point to calibrate your own guesses about what might happen.
But, there is one more thing to remember.
Recall how the UK solved its debt problem after WWI and WWII. That’s right, inflation. Lets look at that same graph of Fed rates that we did earlier, but add inflation to the mix:
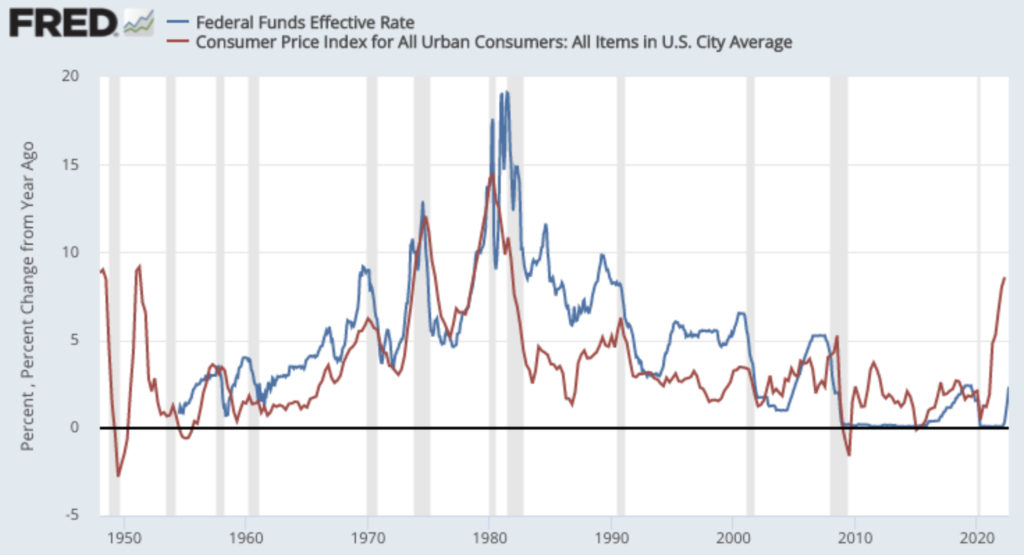
Notice anything? Before 2010, and especially before 2000, the blue line spent most of its time at or above the level of the red line. That means that the fed was setting interest rates above the rate of inflation. Why is that important? Remember that, all else equal, inflation is reducing the real value of the outstanding debt. So, if inflation is above the interest rate on the debt, and if no new debt is added, the real value of the debt is actually going down over time, not up.
For example, lets say you owe your buddy $100, and you don’t have any cash to pay him back. He’s charging you 3% interest, but inflation is 4%. You start out owing him $100. At the end of the year you owe him $103. But, because inflation was 4%, the real value of what you owe him is:
$103 / [1 + 4%] = $99.04.
That’s right, in real terms, you owe him less money at the end of the year, because inflation outpaced the interest rate on the note.
As you can see from the graph above, for the last 20 years, that’s typically what has been happening with the government’s debt. Inflation has been higher than short-term borrowing rates. So, the real balance of the existing short-term debt is falling each year.
So, how does that apply to current day?
As you can see from the previous graph, while the Fed has been raising short term interest rates, the inflation rate over the last year has been much, much higher. So, the net effect has been beneficial to those who owe money (including the US government). If the Fed has to raise rates well beyond 4.5%, it will probably be because inflation continues to be high.
That means, its tough to imagine a scenario where both inflation remains persistently high and the government deficit spins out of control. Remember, persistently high inflation is how the UK got rid of its (over doubly high) debt levels after WWII.
So, once again, let’s answer the original question: is the US national debt sustainable?
Because of lower interest rates, the debt has remained sustainable while also increasing in size over the last decade. Even now, with interest rates rising, inflation is reducing the debt faster than higher rates are growing it. For the debt to become unsustainable, we’d need to see a big shift in trends over the last few decades, which would likely include inflation falling rapidly.
What about the deficit?
We spent so much time talking about the debt, we hardly touched on the deficit. The debt is how much the US has borrowed, and not paid off, since the beginning of its existence. It’s like the total outstanding balance on a credit card.
The deficit is the annual increase in the debt: the difference between what the government spends, and what it collects in taxes. This is like new spending on a credit card, less the payment you make at the end of the month.
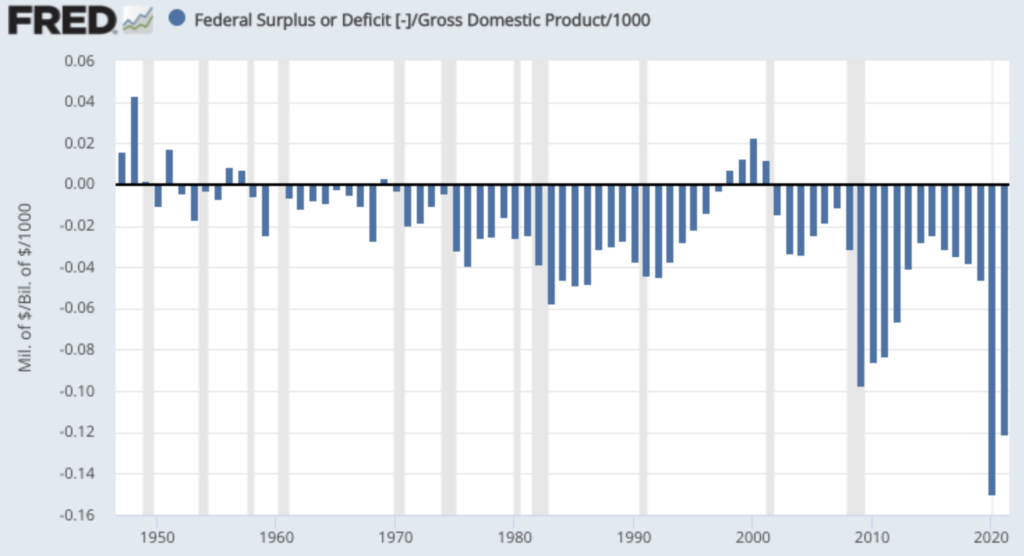
Here’s the history of the deficit. We recently got closest to balancing the budget in the mid 2010s, began to grow the deficit again in the last few years of the decade, and then really blew it out during the past few years.
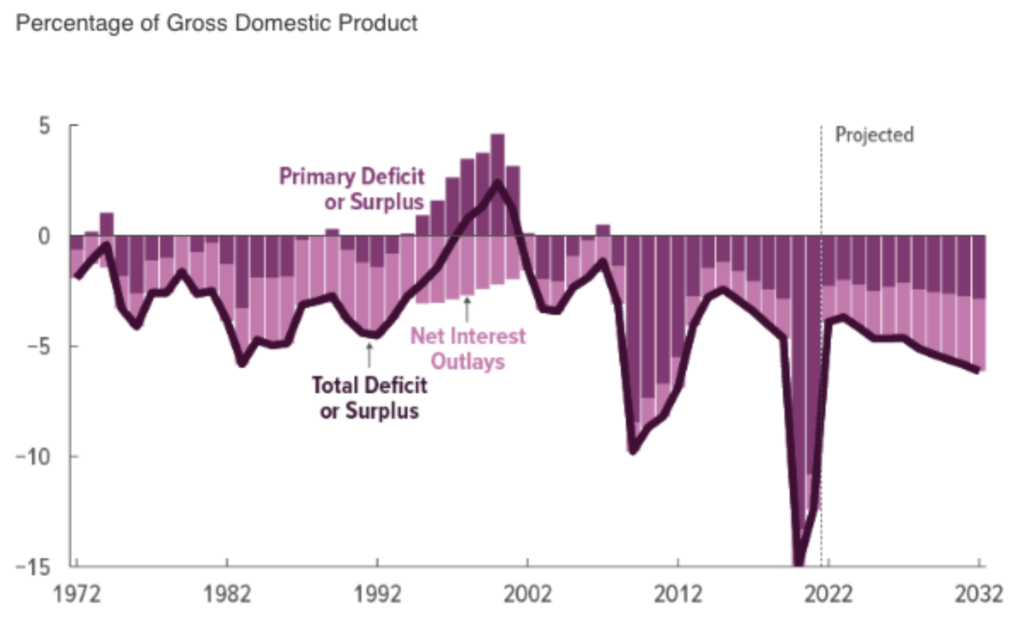
Here’s another fancy chart that shows not just the history, but the projections, and splits it out between interest payments, and the imbalance between taxes and other expenditures. As you can see, under current law, we are expected to quickly rebound to our prior trajectory of slowly increasing the amount we add to the deficit over the next ten years.
So, will the current level of debt, along with the future projected deficits, be sustainable? That’s tough to say definitively! If borrowing rates remain below the level of inflation, maybe so! If rates end up stabilizing significantly above the rate of inflation in the coming years, maybe not.
On this, its worth revisiting one of the first charts we looked at:

You can see that, throughout the 70s we ran budget deficits, but the debt to GDP still shrank. And, while we ran deficits throughout the 2010s, the debt to GDP increased only very slightly.
Depending on what the future holds, the budget deficit may need to be reduced significantly, or we may even need to run budget surpluses like we did in the late 90s (the only period without a budget deficit in the last 50 years).
If we had to, how would we reduce the deficit? Two options: cut spending, or raise taxes. Exactly what will happen is tough to know!
So, what? Are you telling me the US national debt is OK?
I can’t answer that question, because whether you think “the US national debt is OK” depends on a lot of things. It certainly has costs: higher debt levels saddle future generations with interest payments, and leave them less room to borrow for things they find important (like battling future recessions or building future infrastructure). I can’t judge for you whether that future cost imposed by our increased debt is worth what we got for it.
What was more important: fighting the Nazis in WWII, sending a man to the moon in the 60s, preventing the collapse of our banking system in 2008, keeping small businesses from going bankrupt in 2020, or forgiving student loan debt in 2022? While you, and other people, may have strong feelings on the answer to that question, those are questions that data just can’t answer. But, I hope I at least gave you some context around how to think about the debt and deficit going forward!
I can tell you that history does not suggest that current levels of debt have us on an inevitable crash course with economic ruin.
The future is uncertain. And risk is an inevitable part of life and investing. And while there are plenty of valid concerns to hold around the debt and deficit, when it comes to your portfolio, we at Castlepoint do not view the current US national debt as a sure sign of impending economic view that will spill into the stock market.
The content of this article was developed from sources believed to provide accurate information. The information in this article is not intended as tax or legal advice. Please consult legal or tax professionals for specific information regarding your individual situation. All expressions of opinion are subject to change. This content is distributed for informational purposes only, and is not to be construed as an offer, solicitation, recommendation, or endorsement of any particular security, products, or services.